Aside from the common formatting options, there are several formatting capabilities that are specific to Cartesian charts. These functions afford users a lot of control over the design of Cartesian charts, and enable optimization of the chart according to the user's preferences.
Cartesian Formatting Options
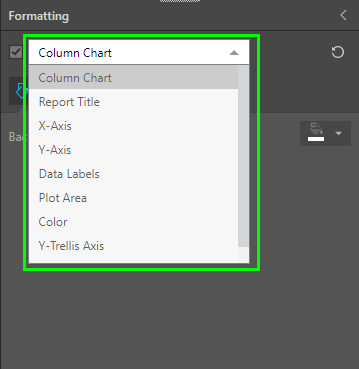
The following options are available from the Formatting panel drop-down when working with Cartesian charts:
- Report Title: customize the report title.
- X-Axis: customize the x-axis labels, title, line, and size.
- Y-Axis: customize the x-axis labels, title, line, and size.
- Data Labels: show or hide data labels, and customize data label fonts, colors, formats, and more.
- Plot Area: customize the plot area by changing the color, adding borders, and changing the axes.
- Legend: edit the report legend by changing its position, layout, and fonts.
- Shapes: change the shape of the data point.
- Color: customize the color and font for a given legend item and the analogous data point.
- Y-Trellis Axis/ X-Trellis Axis: show or hide trellis labels for each chart, and edit the font for trellis labels.
- Multi Chart Title: show the relevant title for each trellised chart